The Easiest Ways to Find Memory Leaks in Your Angular Application with Chrome (beginner’s guide)
- Zsolt

- Mar 15, 2025
- 3 min read
If you are a Medium Member please read there
Let’s start with the basics. Let’s say we have a suspicious component with some complex RxJs operations and many service calls; the whole thing screams it should be refactored, but obviously, we don’t have time, or capacity to do that. But is this component leaking, and how much? If you have suspicions already, I have an article listing a few of the most common ways a component might leak through RxJs:
But back to the basic testing for leaks, just put the suspicious component in an `@if`. Or if you’re just hoping to find all leaks on a page, put the whole thing in an `@if` at the root component of the page.
@Component({
  selector: 'app-leaky-leakerson',
  template: `I'm definitely leaking`,
  standalone: true,
})
export class LeakyComponent implements OnInit, OnDestroy {
  ngOnInit(): void {
    setInterval(() => console.log(this._count++), 1000); // <= DO NOT DO this. this is the simplest leak we can add to showcase leak detection later
    console.log('Initialized');
  }

  ngOnDestroy(): void {
    console.log('Destroyed');
  }
}

@Component({
  selector: 'app-leak-finder',
  template: `@if(show()) {
    <app-leaky-leakerson></app-leaky-leakerson>
    } `,
  standalone: true,
  imports: [LeakyComponent],
})
export class LeakFinderComponent {
  show = signal(true);
}
I’ve added an interval so my showcase Component will leak, and we can later detect that it is leaking. Note that you should not do this; it is here only to illustrate a leaking component. Also, you can try these out and see for yourself that the component is both initialized and destroyed, yet it’s still in the memory.
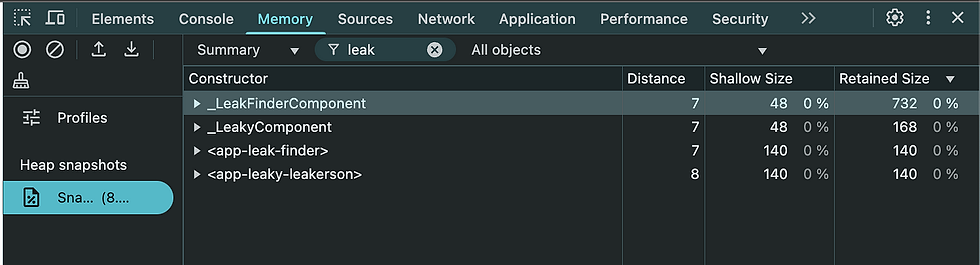
Finding leaky components
Let’s see the easiest scenario. As we have learned (from the linked article), when the leak refers this — the component itself — then the whole component will be leaked, which makes finding it easier. Most cases are such, like in the showcase `console.log(this._count++)` also uses this.
We’ll be using Chrome’s memory snapshots.
How is it the easiest? When you create a memory snapshot, you can filter for constructor names, which means that if the whole component is leaked and you filter for Component (as is the conventional suffix for component classes), then you’ll see all initialized components currently in memory. Now, in complex applications, when there are a lot of instances of a component, that does not necessarily mean leaking. But if there’s over a hundred of the same component and their Distance is relatively high, we must check those components in some sort of isolated leak testing.
// not very CPU and memory efficient, but very effective at finding leaks
constructor() {
    for (let i = 0; i < 199; i++) {
      setTimeout(() => { // <= CD must run
        this.show.set(!this.show());
      }, 1);
    }
  }
A quick way to confirm we have found a leak is to comment out the loop and see the distance and count of LeakyComponent.
Finding leaky objects
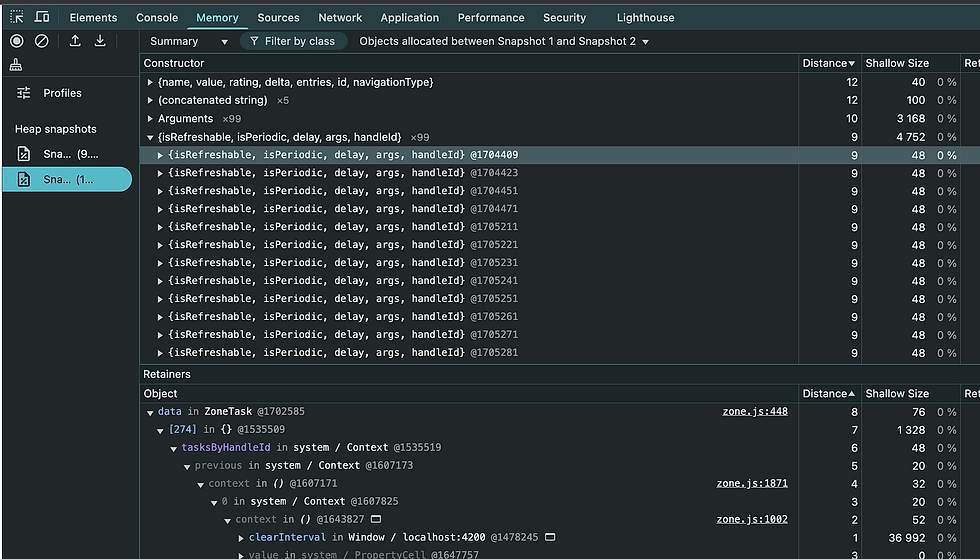
All we need is to change the interval a bit so it’s still leaking but not the whole component.
setInterval(() => console.log('Not referring this anymore'), 1000);This is a tougher cookie, but there are numerous ways to go about it. The most effective one is adding a button or any other sort of trigger.
start from a state where the @if evaluates to true, (click GC, GC, GC)
take a snapshot
trigger showing and hiding, ending with @if being false (click GC, GC)
take a snapshot again
On the second snapshot, set the object filter to “Objects allocated between Snapshot1 and Snapshot2”. There shouldn’t be an overwhelming number of rows in this case, so finding one right around 100 should be easy. It’s also probably at a high distance from the window.
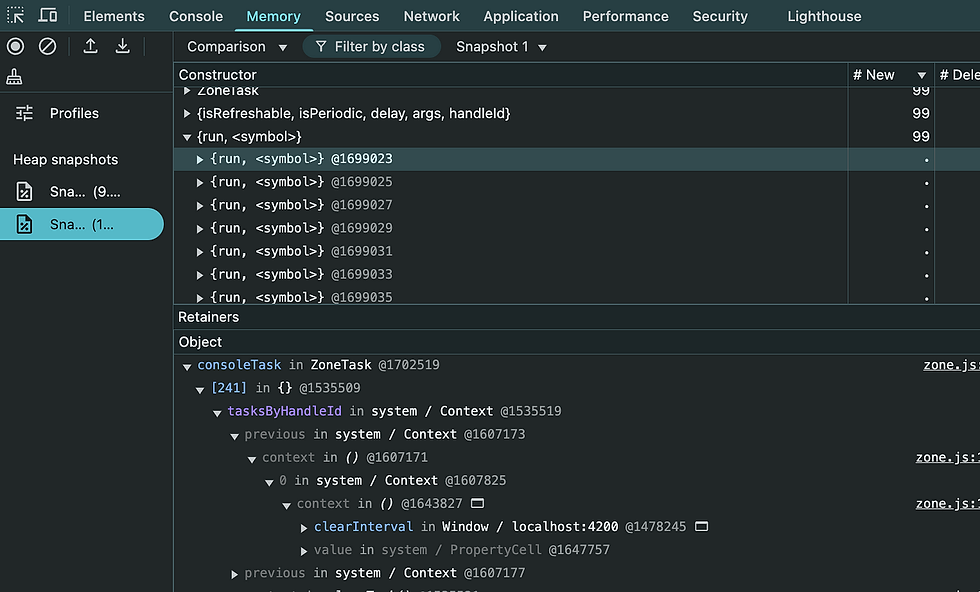
Alternatively, you could use comparison mode. After selecting Snapshot 2 as the base and Snapshot 1 in the top bar, and then look for 99 in” # New” or “# Delta” columns.
Honorable mention
There are, of course, more sophisticated methods and tools available to test for memory leaks, or even automate the process. For casual interest, I wouldn’t necessarily recommend learning their API, but they are definitely worth a mention. One such, and maybe a more popular one, is memlab.


Comments